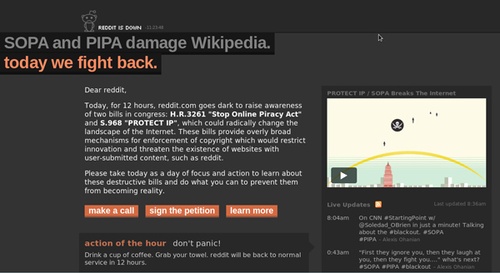
I've had a dataset kicking around for a while on Reddit's resistance to SOPA: 766 Reddit posts and associated comments, obtained through Reddit's API, covering from late 2011 until the day the of the blackouts, 18 January 2012. I've tried a couple of ways to analyse it, mostly thinking from a social movement perspective about how a coherent and ultimately successful resistance emerged.
The first thing I did was read them all, and try out some theory on mobilisation in cases of scientific/technical controversy. The resulting paper came out in First Monday a couple of weeks ago. I sorted the data to look at the top posts per subreddit, top self-posts, and commonly linked sites and domains, which helped to figure out what was important, but it started out as a term paper and I didn't really have time for more quantitative analysis.
During that summer, I proposed a project using named entity recognition on the comments to obtain people and companies that Reddit users singled out as part of various resistance strategies. For example, there was a boycott of GoDaddy, as well as other companies seen to be supporting SOPA, and various congressional representatives were discussed either as potential allies against the bill, or supporters of it who were suitable targets of ridicule for their evident technologically ineptness.
This was partly a ploy to be allowed to take the fantastic Stanford online Natural Language Processing class for credit. Fortunately it worked, because the named entity recognition (using nltk and only just enough knowledge to be dangerous) certainly didn't. Reddit comments, like tweets, lack context information (often even simple things like capitalization are missing), have many different kinds of named entities, and have relatively few named entities in general.
I tried a few other things here and there, mostly as a temporary dissertation avoidance strategy. A little more python allowed me to extract all urls in comments, which I dumped into R to try some network analysis on. Hyperlink network analysis can sometimes produce interesting results, but it doesn't work as well when a lot of the links in your network are to media hosting sites (like youtube) or posts on social networks (facebook, twitter, reddit). In a hyperlink network created by a crawler such as IssueCrawler, domains are assumed to have some meaning, through which there is meaning in how they link to each other. Unfortunately, my dataset (and probably most hyperlink networks these days) was dominated by 'platform' sites that host extremely diverse content. The top 10 domains in the dataset include Wikipedia, Reddit, YouTube, imgur, Twitter and Facebook. Tech news muckracking site Techdirt does make an appearance, as do the Sunlight Foundation's government transparency site, opencongress.org, and thomas.loc.gov, the Library of Congress site for legislative information. This gives a bit of a sense of what kinds of information people were linking to, but doesn't inspire confidence in the ability of a scraping operation to meaningfully connect domains.
Instead of scraping hyperlinks to connect domains, you could also create a network by connecting domains that are mentioned in the same comment thread, or in comments in the same subreddit. Predictably, the first is extremely sparse, and the second is dominated by the same platforms that appear frequently across domains. For completeness, here's a quick visualization made using the sna and network packages in R. Way over there on the left is Canada, specifically the Parliament of Canada, and the Canadian Coalition for Electronic Rights.

A couple of weeks later, I wondered whether you could classify the kinds of evidence (and the kinds of targets) being deployed by Reddit users in comment threads. For example, government - specifically members of congress - were clearly seen as more fruitful targets for influence than anyone in the media industries, and actions were oriented toward influencing the formal political process. I drew up 10 categories - government sites, non-profits, media or tech companies, mainstream and specialist (usually legal or tech) news sites - and asked workers on Mechanical Turk to classify each domain.
This was a complete failure, and (previous bad experiences with Mechanical Turk having lead me to do a test run first with a very small sample) a waste of $4. Mechanical Turk works best when it's easier to choose the right answer than the wrong one. Looking at the error pattern, many of my workers chose to completely disregard the instruction to visit the site, instead guessing based on the top-level domain. I considered looking elsewhere and paying more for better microwork, but concluded the potential findings weren't interesting enough to warrant it.
FINALLY, now quite keen to put this project to bed (and having managed to get my original paper published without additional quantitative work), I hit on the idea of using the Wikipedia links to characterize the problem space. This is actually a pretty common approach. Because wikipedia not only explains concepts but links and categorizes them, it has been used to calculate term similarity, expand queries to suggest related results, and otherwise help computers process and use unstructured texts. This paper has an exhaustive review of work using Wikipedia, mostly in computer science.
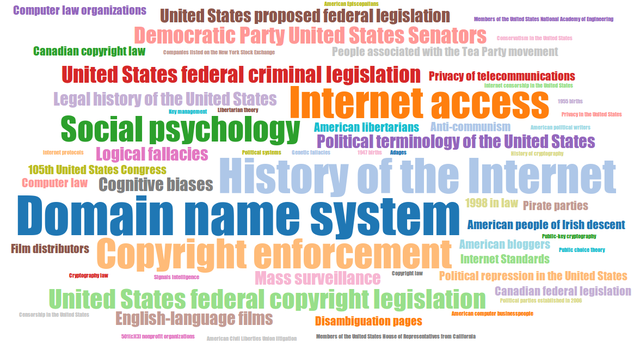
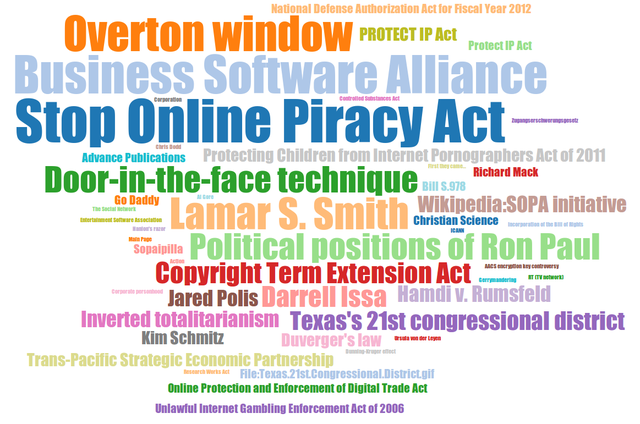
In the end, I didn't pursue links between Wikipedia entries, although this would have been a fun project. Instead, I created two word clouds, one of frequently linked-to topics, and one of their categories. Category information was obtained from the Wikipedia API using wikitools (more python). Word clouds were created with the impressive d3-based d3-cloud javascript library. Word clouds are a bit tricky to use for multi-word topics, but I think they came out ok. Click here for the large version of the categories cloud, here for the large version of the pages cloud.
Most frequently linked Wikipedia categories
This word cloud shows all categories appearing 5 or more times in the dataset. The cutoff was chosen simply to be able to produce a reasonably legible word cloud. Four obvious umbrella categories - Living Persons, 2011 in the United States, 2012 in the United States, 1998 in the United States, 1947 births and 1945 births - were removed.
Most frequently linked Wikipedia topics
This word cloud shows all topics appearing 3 or more times in the dataset. Again, the cutoff is arbitrary - word clouds work best with a small number of words.
Recent Posts
- Heartbeat Choker
- 2014 elections party results maps
- Voter Turnout in the 2014 South African Elections
- Open Access to ICTD Research
- Let them eat cellphones?
Archive
2015
- October (1)
2014
- May (2)
2013
Categories
- arduino (2)
- beforeiforget (4)
- digital methods (1)
- dissertation (1)
- django (2)
- gis (4)
- internet activism (1)
- mobiles and development (1)
- networkanalysis (1)
- R (2)
- research (1)
- sewing (1)
- ubuntu (2)

